IELTS Writing Task 1 - Sample 1: Line graph and Bar chart
IELTS Writing Task 1 - Sample 1: Line graph + Bar chart
Biểu đồ đường (line chart) và biểu đồ cột (bar chart) dạng đơn, phần thi IELTS Writing Task 1 thường hay có câu hỏi mô tả kết hợp giữa Mô tả kết hợp giữa biểu đồ cột và biểu đồ đường (bar chart + line chart). Bên cạnh kỹ năng biết viết mô tả biểu đồ, các bạn còn phải biết cách so sánh và tìm ra xu hướng chung giữa hai biểu đồ này.
IELTS Writing Task 1: Viết General Statement cho Line Graph
Bố cục bài viết (essay structure) tương tự như cách mô tả kết hợp giữa bảng (table) và các biểu đồ khác. Viết mô tả kết hợp giữa 2 biểu đồ cột (2 bar charts) hoặc biểu đồ cột và điểu đồ đường (bar chart + line chart) cũng bao gồm 3 phần: mở bài, thân bài (viết 2 đoạn), kết luận. Tuy nhiên sự khác biệt là bên cạnh viết lời mô tả biểu đồ, bạn cần phải kết hợp với những so sánh và tìm ra xu hướng chung của cả 2 biểu đồ
Từng loại câu hỏi sẽ có cách tiếp cận khác nhau để lựa chọn cấu trúc bài mô tả sao cho phù hợp. Bố cục một bài viết mô tả, so sánh kết hợp giữa 2 biểu đồ cột (hoặc 1 biểu đồ cột, một biểu đồ đường) như sau:
- Phần mở đầu: Giới thiệu chung nhất về đề bài (Viết lại yêu cầu của đề bài bằng cách chuyển ngữ (paraphrasing)). (Nên viết 1 câu)
- Phần chi tiết:
+ Mô tả biều đồ thứ nhất
+ Mô tả biểu đồ thứ hai
- Phần kết luận: So sánh và tìm ra điểm chung, hoặc xu hướng nào đó có liên quan giữa 2 biểu đồ (đây là phần quan trọng khi viết so sánh hai biểu đồ)
Hướng dẫn thực hành mô tả và so sánh dạng câu hỏi với 2 biểu đồ
(dành cho trình độ căn bản)
Câu hỏi 1:
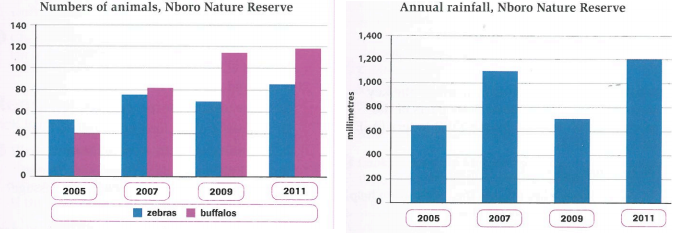
The chart below show information and animal and rainfall at the Nboro Natural Reserve.
Summarise the information by selecting and reporting main features and make comparison where relevant.

(Biểu đồ tham khảo từ sách Complete IELTS )
Yêu cầu 1: Hãy đánh dấu T (true) nếu bạn cho rằng những ý bên dưới này mô tả đúng cho 2 biểu đồ trên, và F (false) nếu bạn tìm thấy một lỗi sai nào đó
1. The chart gives information about the number of zebras and buffalos and the amount of rain at the Nboro Nature Reserve between 2005 and 2011. (T/F)
2. In 2005, there were fewer zebras than buffalos with 40 zebras and 50 buffalos (T/F)
3. From 2005 to 2011, the number of buffalos rose each year till it reached just under 120 (T/F)
4. On the other hand, the number of zebras fell to 75 in 2007 and went up to 70 animals in 2009. (T/F)
5. Zebras population then increased again to reach about 85 in 2011. (T/F)
6. During the same period, there were 1,000 millimetters of the rain in 2005. (T/F)
7. The amount rose to 1,100 millimeters in 2007 and dropped to 700 millimeters in 2009, when there a little rain. (T/F)
8. However, in 2011, 1,200 millimeters of rain fell. (T/F)
9. Overall, number of both animals have decreased over the six-year period, but the amount of rain appear to affect the number of zebras. (T/F)
10. When there is more rain, there are more zebras. (T/F)
Yêu cầu 2. Hãy sắp xếp lại những câu từ 1-10 vào thành từ đoạn văn theo nội dung được yêu cầu bên dưới (Lưu ý áp dụng bố cục một bài biết trong phần mô tả hai biểu đồ đã được hướng dẫn ở trên)
a. Mô tả thông tin chung cho các biểu đồ
b. Mô tả tổng quan về những thông tin nổi bật và so sánh giữa hai loài : ngựa vằn (zebras) và trâu (buffalos)
c. Mô tả tổng qua về thông tin lượng mưa trong cùng thời gian
d. Đưa ra nhận xét tổng quan và điểm liên quan giữa 2 biểu đồ.
Yêu cầu 3: Tìm trong bài những từ, cụm từ đồng nghĩa với rose (tăng) và fell (giảm)
Yêu cầu 4: Giới từ thường xuyên được sử dụng trong phần mô tả biểu đồ. Do đó, cần phải biết cách dùng các giới từ sao cho chính xác và tránh lẫn lộn giữa các giới từ. Xác định giới từ đúng cho các trường hợp bên dưới:
1. They started the reseach in/on 2002.
2. The number of animals increased from/ between 2004 and 2008
3. Anverage temperatures decreased from/ between 2006 to 2010
4. Animal numbers increased by 20% during/from this period.
5. Rainfall went up between/ over the six-month period.
Yêu cầu 5: Hãy chắc rằng bạn sẽ không mắc phải những lỗi sai về sử dụng giới từ, hãy tự mình tìm ra lỗi sai về sử dụng giới từ trong những câu bên dưới:
1. The charts compare numbers of elephants across 1981 and 2001
2. The figures increased during 1950 to 1965.
3. The oldest nature reserve in Spain was established on 1918.
4. The temperature fell from 25 degress to 15 degrees on July and it recovered slowly.
5. This is information about rainfall in Australia since 1990 to 2010.
Câu hỏi 2 (Căn bản)
Yêu cầu 1: Đọc biểu câu hỏi bên dưới với dạng câu hỏi miêu tả kết hợp 2 biểu đồ cột (2 bar charts)
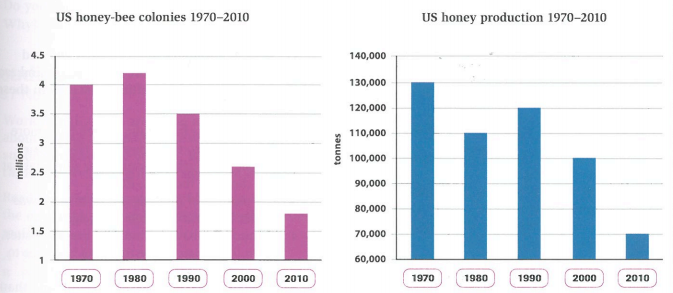
The charts below show information about honey-bee colonies and honey production in the US.
Summarise the information by selecting and reporting the main features and make comparisions where relavant.

(Biểu đồ tham khảo từ sách Complete IELTS )
Yêu cầu 2: Trả lời những câu hỏi sau để có ý và những ghi chú cần thiết khi mô tả các biểu đồ ở bài tập 2.
1. What does each chart show, and what years are convered by the charts?
2. Are these words countable or uncountable?
a. colony b. honey
3. How many honey-bee colonies were there in 1970, and how much honey did they produce?
4. Did these fingures rise or fall from 1970 to 1980? What comparision can you make about this period?
5. Did these figures rise or fall from 1980 to 1990? what comparion can you make?
6. Did honey-bee colonies and honey production rise or fall between 1990 and 2010?
7. For four overview, what in general can you say about bee colonies and honey production between 1970 and 2010?
Yêu cầu 3: Hãy xác định bố cục của bài dựa vào ví dụ mẫu ở bài tập 1 hoặc phần lý thuyết sau đó viết một bài luận mô tả và so sánh thông tin được biểu thị ở biểu đồ trong bài tập 2 này
Câu hỏi 3 (trung cấp)
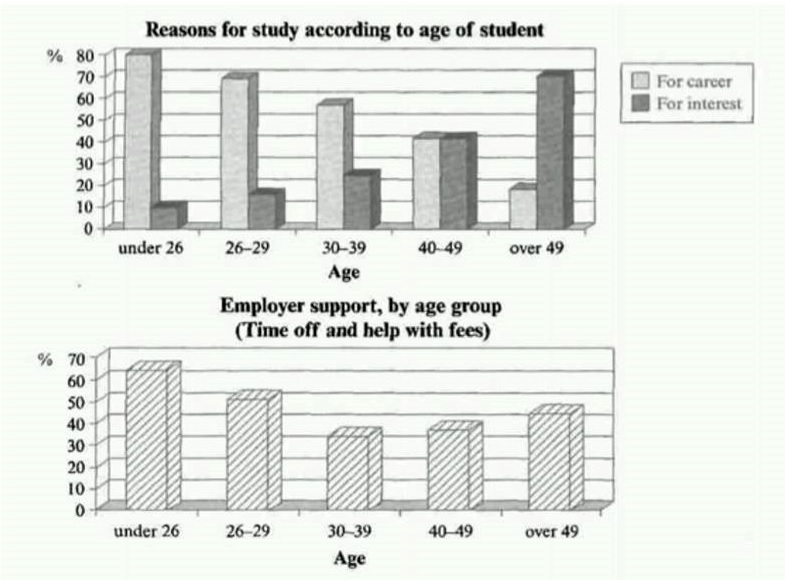
The chart below show how the main reasons for study among students of different age group and the amount of support they recieved from employers.
Summarize the information by selecting and reporting the main features and make comparisons where relevant.

Bài viết mẫu:
The bar charts compare students of different ages in terms of why they are studying and whether they are supported by an employer.
It is clear that the proportion of students who study for career purposes is far higher among the younger age groups, while the oldest students are more likely to study for interest. Employer support is more commonly given to younger students.
Around 80% of students aged under 26 study to further their careers, whereas only 10% study purely out of interest. The gap between these two proportions narrows as students get older, and the figures for those in their forties are the same, at about 40%. Students aged over 49 overwhelmingly study for interest (70%) rather than for professional reasons (less than 20%).
Just over 60% of students aged under 26 are supported by their employers. By contrast, the 30-39 age group is the most self-sufficient, with only 30% being given time off and help with fees. The figures rise slightly for students in their forties and for those aged 50 or more.
Câu hỏi 4 (trung cấp)
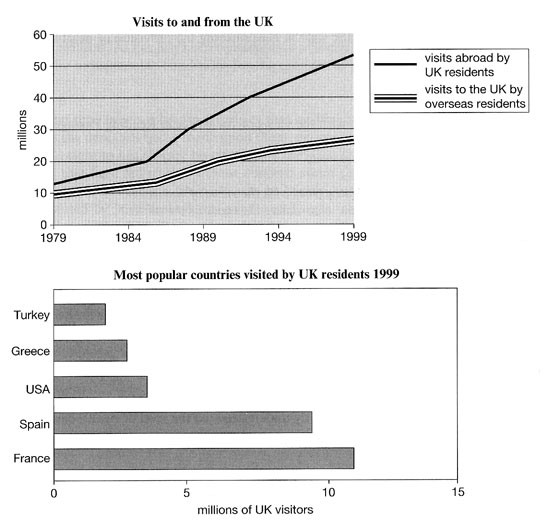
The line graph shows visits to and from the UK from 1979 to 1999, and the bar graph shows the most popular countries visited by UK residents in 1999.
Summarize the information by selecting and reporting the main features and make comparisons where relevant.

Bài viết mẫu
The line graph illustrates the number of visitors in millions from the UK who went abroad and those that came to the UK between 1979 and 1999, while the bar chart shows which countries were the most popular for UK residents to visit in 1999.
Overall, it can be seen that visits to and from the UK increased, and that France was the most popular country to go to.
To begin, the number of visits abroad by UK residents was higher than for those thatcame to the UK, and this remained so throughout the period. The figures started at asimilar amount, around 10 million, but visits abroad increased significantly to over 50 million, whereas the number of overseas residents rose steadily to reach just under 30 million.
By far the most popular countries to visit in 1999 were France at approximately 11 million visitors, followed by Spain at 9 million. The USA, Greece, and Turkey were far less popular at around 4, 3 and 2 million visitors respectively.


