Academic IELTS Writing task 1 Sample 1
Academic IELTS Writing task 1 Sample 1
Thí sinh thi IELTS được khuyến cáo rằng chỉ nên dành 20 phút cho bài IELTS writing task 1, và đây cũng có thể nói là bài "kiếm điểm" cho họ. Tuy nhiên, không phải ai cũng đạt được điểm số cao cho bài này vì chưa biết phân tích câu hỏi, tìm ý cũng như trình bày các ý một cách hiệu quả. Hãy tham khảo các bài mẫu Academic IELTS Writing task 1 Sample 1 sau đây.
IELTS Writing Task 1 - Sample 1: Line graph and Bar chart
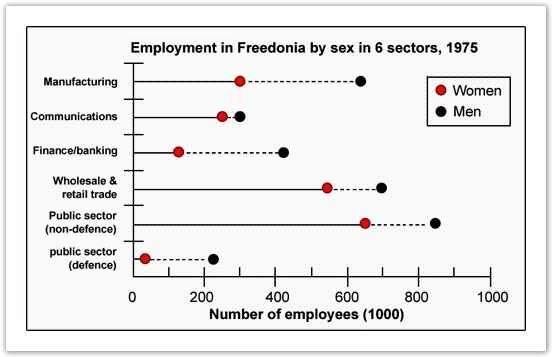
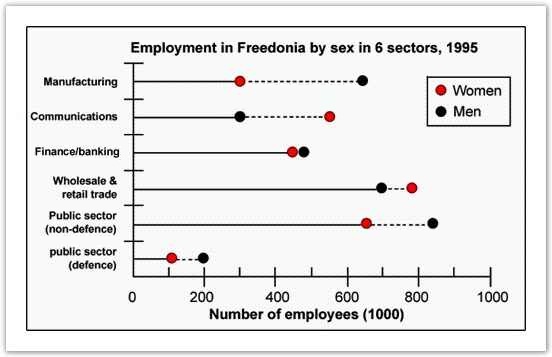
The graphs below show the numbers of male and female workers in 1975 and 1995 in several employment sectors of the republic of Freedonia.


Write a report for a university teacher describing the information shown.
» You should write at least 150 words.
» You should spend about 20 minutes on this task.
Sample Answer 1:
The given diagrams compare the male and female employment status in six different job sectors in two different years – 1975 & 1995. As is seen from the given illustration, men were well ahead of women in all the job sectors in Freedonia in 1975. However, the scenario changed in the 1995 and women did a remarkable progress in their professions.
According to the given diagrams, men in Freedonia were well ahead of female in manufacturing, finance/banking, wholesale & retail trade, defence and non-defence sectors. In manufacturing more than 600 male employees could be seen against only 300 female employees. Except in communication sector, the proportion of male employees was far greater than that of females. Among the given job sectors, the public /non-defence sector had the highest number of employees while the defence sector had the least number of employees.
After 20 years, women showed an outstanding advancement in the job sectors and they went well ahead of men in communication, wholesale & retail trade sectors. They become almost equal in number in finance and banking jobs while the gap between male and female employees' numbers reduced in defence jobs. The only sector that was still male dominant was manufacturing and the job ratio in this sector remained almost same as it was 20 years earlier.
Sample Answer 2:
The given two graphs show the information about employment scenario in Fredonia by gender in six different employment sectors during 1975 and 1995. It is very clear from the overall trend that men were pretty much dominating the job markets both during 1975 and 1995, but women made progress in the given 20 years period.
According to the first graph that depicts the employment status in 1975, there were far more male employees in all the employment sectors than its opposite sex. Nearly half of the employees in the manufacturing industry were men. Most strikingly, 75% of finance sector employees were male. However, women appeared to be competing shoulder to shoulder against their male counterpart in the communication sectors.
Turning to the 1995 data, females had made a significant improvement in securing jobs in different employment sectors. Om top of that, women outmatched the male counterpart in securing jobs in communication and wholesale & retail trade industry. Furthermore, nearly half of the communication sector employees were women. In finance sector as well, women were not very far behind.
Comparing the two graphs, it seems very clear that in between those twenty years the number of male employees in these sectors had remained considerably the same, but there was a considerable increase of female employees in the majority of these job sectors.
[Written by - Dorji]
Sample Answer 3:
The given graphs provide data on the workforce in six different professions in the republic of Freedonia in 1975 and 1995. As is observed, the graphs illustrate the progress of empowering women in the work market over the twenty years, even the number of females exceeded the number of males in some work fields.
In 1975, the number of employed men was considerably higher compared to the number of women in all sectors, in particular, manufacturing, finance and banking and public sector (defence). By 1995 there was a significant increase in the number of working females in communication, finance and marketing and wholesale and retail trade, where the number of employed women in these sectors was around 250, 120 and 550 out of thousands respectively and it rose by approximately 300 out of thousand in each sector. Taking into consideration the number of women surpassed the number of men in communication and wholesale and retail sectors, it is evident that women empowerment in employment sectors in Freedonia had significantly progressed in the given period.
[Written by - Philomina]
Sample Answer 4:
The given line graphs illustrate the number of male and female workers in various employment sectors of the republic of Fredonia in the year 1975 and 1995. The first point to note is that the highest number of male and female workers were occupied in the public sector and wholesale and retail trade sector in both years.
Public sector occupied the same number of employees in both two years that is 840 males and 640 females. Wholesale and retail trade sector stands close behind with 650 male and 460 female employees in the year 1975, while a slight reverse order in the year 1995 with 800 females and 650 males. Manufacturing section consumes almost an equal number of employees in both years with 600 males and half of its females. Interestingly, almost an equal number of employees in communication sector in the year 1975 with 240 and 250 females and males respectively, changed to its double in female workers and with the same number of male workers in the year 1995. This same trend was shown in finance and banking sector. However, defence public sector occupied the lowest number with 10 female and 210 male workers in the year 1975 and 100 females and its double male workers in the year 1995.
In conclusion, it is clear from the graphs that, there are fluctuations in the number in both years. But male employees are more compared to females in almost all the sectors in the given years.
(Approximately 238 words/ Written by - Jayesh Joseph )
Model Answer 5:
The provided illustrations compare the male and female workers in different employment sectors in Freedonia over 20 years of time by providing data for the years 1975 and 1995. As is observed from the given line graphs, women were far behind in employment in Freedonia in 1975 but within 20 years they made remarkable progress almost in all sectors and went well ahead of men in communications and wholesale & retail trade sectors.
The graphs compare the number of male and female workers in 6 different sectors of Freedonia per thousand. In 1975, more men than women were employed in almost all the mentioned sectors of job categories. For instance, approximately 650 men were employed in manufacturing related jobs compared to only 300 women per thousand of total employees in the same sectors. In almost all other cases, the numbers of male employees were much higher than the women and in communication sectors men were bit ahead than female in their employment ration. After 20 years, in 1995, women made outstanding progress in Freedonian job sectors. For instance, in communication sectors almost 600 female were employed compared to 300 male workers per thousand. Women went ahead of men in wholesale & retail trade sectors too. Except for the public sectors (non-defence) women hold the trends of progress compared to men in all other sectors. In 1975 only about 40 women worked in defence sectors and this number grew to more than 100 per thousand after 20 years.
In summary women did remarkable progress in Freedonian job fields over 20 years and they went ahead of men in many job sectors.
(Approximately 270 words)
(These two model answers can be followed as examples of a well-written answer. However, please note that this is just one example out of many possible approaches.)
Sample Answer 6:
The provided line graphs compare the employment history of men and women in 1975 and 1995 dividing in six major sectors namely: manufacturing, communications, finance/ banking, wholesale & retail trade, non-defence public sectors and defence public sectors. As is observed from the given illustration, significant changes have been made in women's employment and women appear to have made remarkable improvements in almost the entire job sectors in Freedonia and in some sectors women went well ahead of men.
Initially, in 1975, men were notably ahead of women in every sector of employment. For example, in communication sector about 260 men worked against 220 women in every thousand employees. Twenty years later, though the number of men remained unchanged, the number of women rose to over 550 in one thousand. A similar trend can be seen in the wholesale and retail trade sector, where the number of women rose from about 550 to almost 800 in every 1000 employees of this sector two decades later. The number of men in this sector remained stable over the period, at around 700 / thousand.
Women also made their prominence in both the finance/ banking industries and in the defence-related public sector during this period. Where 125 women among one thousand employees worked in finance & banking institutions in 1975, this number increased to 450 by 1995. The number of men grew only marginally from 425 to 480 over the same period. In defence sector, the number of men declined from 225 to 200 per thousand, while the number of women rose from 25 to over 100 per thousand. Two sectors that remained almost stable in terms of men and women employee ration are manufacturing and public sector. In manufacturing, about 300 women and 650 men worked in both surveyed years, and in public sector (non-defence), which employed 650 women and 850 men.
In conclusion, we can say that women appear to have made gains in the workforce in Freedonia and in some sectors they went well ahead compared to men.
Tips for Answering this Academic Writing Task 1 Question:
1. Two line graphs are provided in this writing task 1, so start the introduction part as follows:
The given line graphs provide data on.....
Do not use, 'the give line graph shows...' as there are more than one graphs present in this question.
2. The two line graphs compare the number of male and female employees in 6 employment sectors in Freedonia. The first graph shows the data for the year 1975 while the second graph shows data for the year 1995.
3. The first graph shows that the male employees were well ahead in all the job sectors in Freedonia. But after 20 years that scenario changed and women did a remarkable progress in the job sectors.
4. Initially, in 1975, men were higher in number in terms of their involvement in different work sectors. Only in Finance and Banking sector, female were close to the male.
5. After 20 years in 1995, the number of women employees crossed the number of men employees in communications & wholesale & retail trade sectors.
6. In communication sector, the number of women employees reached to 550 per thousand while this number was only 210 per thousand in 1975.
7. Do not only give the numbers of male and female employees in 6 job sectors of Freedonia in 1975 and 1995. Rather make a comparison of the male and female employee numbers and show some of the comparisons for women about how many of them were employed in 1975 and how these numbers have increased in 1995. Keep in mind that the writing expects you to be able to compare the women's improvement and increasing involvement in job sectors of Freedonia.


