Tiếng Anh 12 Unit 7 lesson 3 i-Learn Smart World
Tiếng Anh 12 Smart World Unit 7 lesson 3 trang 82
Giải SGK tiếng Anh 12 i-Learn Smart World unit 7 lesson 3 bao gồm đáp án chi tiết các phần bài tập xuất hiện trong SGK unit 7 Lesson 3 Urbanization i-Learn Smart World giúp các em chuẩn bị bài tập tại nhà hiệu quả.
Let's Talk!
In pairs: Look at the pictures. What problems with overpopulation can you see? How could they he solved? Theo cặp: Quan sát các bức tranh. Bạn có thể thấy vấn đề gì với tình trạng quá tải dân số? Làm sao họ có thể giải quyết được?

Đáp án
Picture 1: There was a lot of trash in the bin, and they even fell out. To solve this problem, we can increase the frequency of trash collection and educate residents about proper waste disposal and encourage them to recycle and compost whenever possible.
Picture 2: A homeless person is lying down. To solve this problem, we can providing access to affordable housing, mental health services.
Listening
a. Listen to someone talking about overpopulation. Does the speaker believe overpopulation is a problem that can be managed? Hãy nghe ai đó nói về tình trạng quá tải dân số. Người nói có tin rằng dân số quá đông là một vấn đề có thể giải quyết được không?
Đáp án
Yes. Because he also suggests some solutions to manage overpopulation.
b. Now, listen and circle True or False. Nghe và khoanh đúng hoặc sai.
1. The world s population was over 4 billion in 1960. True/False
2. The world’s population more than doubled between 1960 and 2020. True/False.
3. About 56% of people lived in urban areas in 1960. True/False
4. The speaker says that healthcare will be an issue in urban areas. True/False
5. The speaker says laws may need to change because of the increased population. True/False
Đáp án
1. False.
2. True
3. False.
4. True
5. True
Nội dung bài nghe
Everyone welcome Professor Tate. He's here to talk about overpopulation.
Thank you. Many people believe overpopulation is the biggest problem on our planet.
The population of the world is continuing to increase in 1960 the world's population was around 3 billion people. In 2020, it was just under 8 billion people. That is over two and a half times more people in just 60 years living on the planet that can't get any bigger. These changes are very clear in urban areas where populations have risen the most. In 1960, only about 34% of people lived in urban areas, while in 2020, around 56% of people lived in urban areas. This percentage is still increasing. The United Nations said that they believe 68% of people will live in urban areas by 2050. An increased urban population means that these urban areas need to develop an upgrade quickly. The increased population will likely cause issues with transportation, energy, sanitation, education, housing, food production, health care, and much more. But all hope is not lost. There are things we can do. A lot of infrastructure will need to be built, such as roads, railways, schools, and hospitals. Laws and rules will also likely need to change due to the increase in population. For example, maybe families will only be allowed to own a single car, or people won't be allowed to drive in certain areas to help reduce traffic. New jobs are…
c. In pairs: Is overpopulation an issue where you live? Why (not)? Theo cặp: Dân số quá đông có phải là vấn đề ở nơi bạn sống không? Tại sao (không)?
Đáp án
Overpopulation can be an issue in my hometown due to strain on resources, infrastructure, and environmental degradation.
Reading
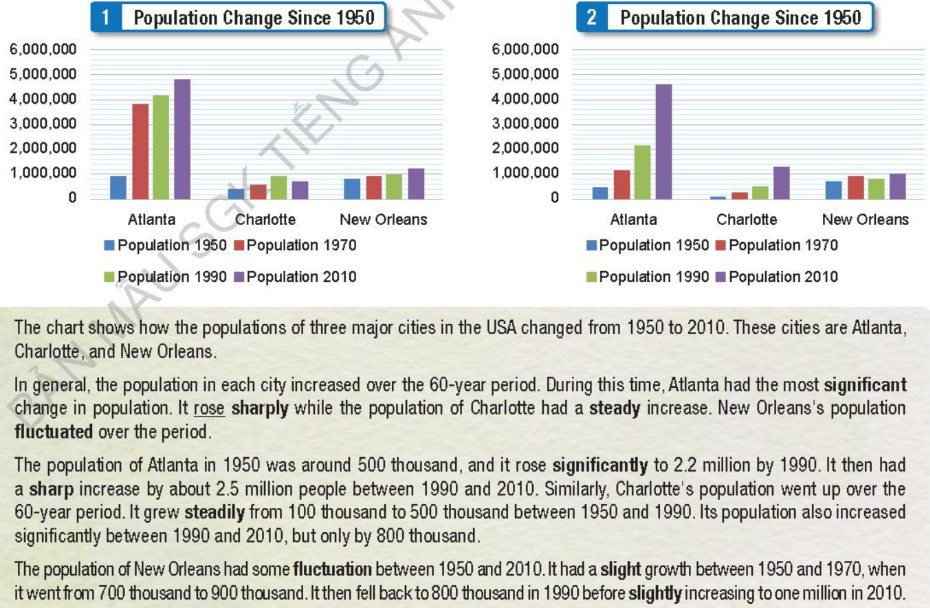
a. Read the report and look at the charts. Which chart is the report talking about? Đọc báo cáo và nhìn vào biểu đồ. Báo cáo đang nói về biểu đồ nào?
Đáp án
The second chart.
b. Match both forms of the bold words in the text with their definitions. Nối cả hai dạng của từ in đậm trong văn bản với định nghĩa của chúng.
1. ___/___ : very small in degree/very little
2. ___/___ : sudden and large change/sudden and by a large amount
3. ___/___ : growing slowly in an even way/slowly and in an even way
4. ___/___ : large enough to be noticed easily/in a way that is large enough to be noticed easily
5. ___/___ : change in amount often/one of many changes in amount from one time to the next
Đáp án
1. slight/slightly
2. sharply/sharp
3. steady/steadily
4. significant/significantly
5. fluctuate/fluctuation
c. Now, read and choose the correct answers. Đọc và chọn đáp án đúng.
1. The word rose in paragraph 2 is closest in meaning to ____
A. went down
B. flower
C. increased
2. The population of Atlanta ___
A. grew by 2.2 million between 1950 and 1990
B. increased by about 2.5 million in1990
C. went up to 2.2 million by 1990
3. Between 1950 and 1990, Charlotte's population ____
A. went up by 100 thousand
B. went up by 400 thousand
C. went up by 500 thousand
4. Which of the following is NOT true about New Orleans according to paragraph 4?
A. The population didn't change.
B. The population was one million in 2010.
C. The population increased a bit after 1990.
5. Which city had the largest population in 1950?
A. Atlanta
B. New Orleans
C. Charlotte
Đáp án
1. C
2. C
3. B
4. A
5. B
d. Listen and read. Nghe và đọc.
e. In pairs: What reasons would make someone move to a city? Why would people move away from a city? Theo cặp: Những lý do nào khiến một người chuyển đến thành phố? Tại sao mọi người lại di chuyển khỏi một thành phố?
Đáp án
Person 1: People often move to cities for better job opportunities and higher salaries, as urban areas typically offer a wider range of employment options and career advancement prospects.
Person 2: That's true. Cities also provide access to better amenities and services, such as healthcare, education, and entertainment, which can improve quality of life and attract individuals seeking a more convenient and vibrant lifestyle.
Person 1: Definitely. However, there are also reasons why people might move away from cities.
Person 2: One common reason is the high cost of living, including expensive housing prices and living expenses, which can become unsustainable for some individuals, especially those with lower incomes.
Person 1: Right. Additionally, some people may move away from cities due to concerns about pollution, overcrowding, and the fast-paced lifestyle, seeking quieter and more environmentally friendly alternatives in suburban or rural areas.
Person 2: Exactly. Ultimately, people's decisions to move to or away from cities are influenced by a combination of factors related to job opportunities, lifestyle preferences, affordability, and environmental considerations.
Writing
a. Read about writing reports on bar charts, then read the report again and write I beside the introduction, 0 beside the overview, and B beside the body paragraphs. Đọc về cách viết báo cáo trên biểu đồ thanh, sau đó đọc lại báo cáo và viết I bên cạnh phần giới thiệu, 0 bên cạnh phần tổng quan và B bên cạnh các đoạn thân bài.
Đáp án
The chart shows how the populations of three major cities in the USA changed from 1950 to 2010. These cities are Atlanta. Charlotte, and New Orleans. /
In general, the population in each city increased over the 60-year period. During this time. Atlanta had the most significant change in population. It rose sharply while the population of Charlotte had a steady increase. New Orleans s population fluctuated over the period. 0
The population of Atlanta in 1950 was around 500 thousand. and it rose significantly to 2.2 million by 1990. It then had a sharp increase by about 2.5 million people between 1990 and 2010. Similarly. Charlotte's population went up over the 60-year period. It grew steadily from 100 thousand to 500 thousand between 1950 and 1990. Its population also increased significantly between 1990 and 2010, but only by 800 thousand. B
The population of New Orleans had some fluctuation between 1950 and 2010. It had a slight growth between 1950 and 1970. when it went from 700 thousand to 900 thousand. It then fell back to 800 thousand in 1990 before slightly increasing to one million in 2010. B
b. Why do you think the report was organized like that? Bạn nghĩ tại sao báo cáo được sắp xếp như vậy?
Đáp án
c. Read the sentences and write I for introduction, 0 for overview, and B for body. Đọc các câu và viết I để giới thiệu, 0 cho phần tổng quan, và B cho phần nội dung.
Đáp án
1 - B
2 - B
3 - B
4 - I
5 - O
6 - B
Speaking
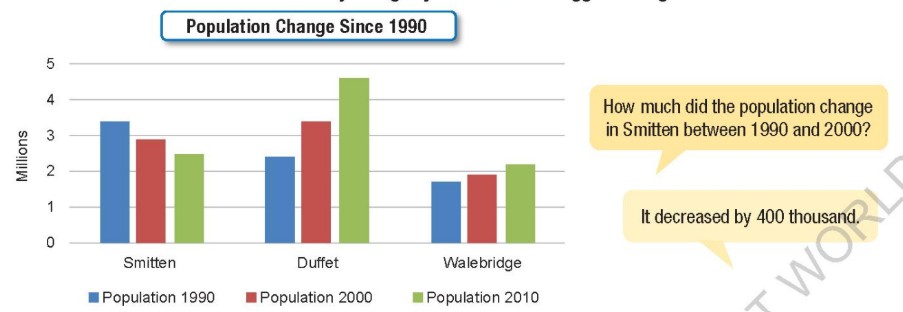
a. In pairs: Ask and answer about the information on the chart. How did populations change? How much did they change by? What was the biggest change? Theo cặp: Hỏi và trả lời về thông tin trên biểu đồ. Dân số đã thay đổi như thế nào? Họ đã thay đổi bao nhiêu? Sự thay đổi lớn nhất là gì?
Đáp án
-How much did the population change in Smitten between 2000 and 2010?
It decreased by 400 thousand.
-How much did the population change in Duffet between 1990 and 2010?
It increased by 2.1 million.
-How much did the population change in Walebridge between 1990 and 2000?
It increased slightly by 200 thousand.
-The biggest change was population increase in Duffet between 1990 and 2010.
b. Complete the table to make an outline for your report. Hoàn thành bảng để làm dàn ý cho báo cáo của bạn.
Đáp án
| City | Trend | Supporting details |
| Smithton | Moderate decrease | Population falls from more than 3million in 1990 to 2.5 million in 2010. |
| Duffer | Significant increase | Population grew from around 2 million in 1990 to 4.6 million in 2010. |
| Walebridge | Slight increase | Population grew from 1.8 million in 1990 to 2.2 million in 2010. |
Useful language
a. Read the report again. Circle the phrases in the box below that appear in the text. Đọc lại báo cáo. Khoanh tròn các cụm từ trong hộp bên dưới xuất hiện trong đoạn văn.
Phrases to introduce trends
Overall, ...
Throughout (the 1990's) ...
In general…
Phrases to introduce data
from ... to ...
between ... and ...
... a further (5 million) ...
b. Rewrite the sentences using a different word or phrase for the words or phrases in bold. Viết lại câu bằng cách sử dụng một từ hoặc cụm từ khác cho các từ hoặc cụm từ in đậm.
1. In general, populations of the three cities increased over the 60-year period.
Overall, populations grew between 1960 and 2070.
2. However, it increased sharply between 1980 and 1990.
3.The population grew by another 2 million.
4. The population slowly increased from 1950 to 2010.
5.However, it dropped between 1940 and 1960.
Đáp án
2. However, it increased sharply during the period from 1980 to 1990.
3.The population grew by an additional 2 million.
4. The population slowly increased over the period spanning from 1950 to 2010.
5. However, it dropped from 1940 to 1960.
Let’s write
Now, write a report about the information in the bar chart. Summarize the information by selecting and reporting the main features, and make comparisons. Use the Writing Skill box, the reading model, and your speaking notes to help you. Write 180-200 words. Bây giờ, hãy viết báo cáo về thông tin trong biểu đồ cột. Tóm tắt thông tin bằng cách lựa chọn và báo cáo các tính năng chính và so sánh. Sử dụng hộp Kỹ năng Viết, mẫu bài đọc và ghi chú nói của bạn để giúp bạn. Viết 180-200 từ.
Đáp án
The bar chart illustrates the population changes in three cities—Smitten, Duffet, and Walebridge—between 1990, 2000, and 2010.
Smitten experienced a steady decline in population over the 20-year period. In 1990, the population was just over 3 million. It dropped to approximately 2.6 million in 2000, and further to 2.5 million by 2010. The total decrease of around 500,000 people suggests long-term outmigration or reduced birth rates.
In contrast, Duffet showed a strong upward trend. The population increased from around 2.5 million in 1990 to 3.5 million in 2000, and then reached approximately 4.6 million by 2010. This significant growth indicates rapid urban development and possibly higher employment opportunities.
Walebridge saw a gradual increase in population. Starting at about 1.8 million in 1990, the population rose slightly to 2 million in 2000 and then to 2.2 million in 2010. Although not as dramatic as Duffet, the upward trend shows steady urbanization.
In summary, while Smitten’s population declined over time, both Duffet and Walebridge experienced growth. Duffet had the most dramatic increase, whereas Walebridge’s growth was modest but consistent.
Hướng dẫn dịch
Biểu đồ cột minh họa sự thay đổi dân số ở ba thành phố—Smitten, Duffet và Walebridge—trong khoảng thời gian từ năm 1990, 2000 đến năm 2010.
Thành phố Smitten trải qua sự suy giảm dân số đều đặn trong suốt 20 năm. Năm 1990, dân số chỉ hơn 3 triệu người. Con số này giảm xuống còn khoảng 2,6 triệu người vào năm 2000, và tiếp tục giảm xuống 2,5 triệu người vào năm 2010. Tổng mức giảm khoảng 500.000 người cho thấy tình trạng di cư ra ngoài trong dài hạn hoặc tỷ lệ sinh giảm.
Ngược lại, Duffet cho thấy xu hướng tăng mạnh. Dân số tăng từ khoảng 2,5 triệu người năm 1990 lên 3,5 triệu người năm 2000, và sau đó đạt khoảng 4,6 triệu người vào năm 2010. Sự tăng trưởng đáng kể này cho thấy sự phát triển đô thị nhanh chóng và có thể dẫn đến nhiều cơ hội việc làm hơn.
Thành phố Walebridge chứng kiến sự gia tăng dân số dần dần. Bắt đầu từ khoảng 1,8 triệu người vào năm 1990, dân số tăng nhẹ lên 2 triệu người vào năm 2000 và sau đó lên 2,2 triệu người vào năm 2010. Mặc dù không tăng mạnh như ở Duffet, xu hướng tăng này cho thấy quá trình đô thị hóa diễn ra ổn định.
Tóm lại, trong khi dân số của Smitten giảm dần theo thời gian, cả Duffet và Walebridge đều trải qua sự tăng trưởng. Duffet có mức tăng trưởng mạnh nhất, trong khi Walebridge tăng trưởng khiêm tốn nhưng ổn định.

