IELTS Writing Task 1 Simon
IELTS Writing Task 1 Simon - Luyện thi Task 1 IELTS Writing
IELTS Writing Task 1 Simon là tài liệu hướng dẫn viết Task 1 của thầy Simon giúp các bạn luyện thi IELTS Writing Task 1 hiệu quả, tài liệu đưa ra cách làm bài, giúp các bạn triển khai ý tưởng và có cách viết giúp đạt điểm cao trong bài thi IELTS. Mời các bạn tham khảo.
1. Line graph
1.1 Tips for Line graph
Line graphs always show changes over time. Here's some advice about how to describe them:
- Try to write 4 paragraphs - introduction, summary of main points, 2 detail paragraphs.
- For your summary paragraph, look at the "big picture" - what changes happened to all of the lines from the beginning to the end of the period shown (i.e. from the first year to the last). Is there a trend that all of the lines follow (e.g. an overall increase)?
- You don't need to give numbers in your summary paragraph. Numbers are specific details. Just mention general things like 'overall change', 'highest' and 'lowest', without giving specific figures.
- Never describe each line separately. The examiner wants to see comparisons.
- If the graph shows years, you won't have time to mention all of them. The key years to describe are the first year and the last year. You should also mention any 'special' years (e.g. a peak or a significant rise/fall).
- Start describing details (paragraph 3) with a comparison of the lines for the first year shown on the graph (e.g. in 1990, the number of...).
- Use the past simple (increased, fell) for past years, and 'will' or 'is expected/predicted to' for future years.
- Don't use the passive (e.g. the number was increased), continuous (e.g. the number was increasing), or perfect tenses (e.g. the number has increased).
1.2 Internet Users as percentage of population

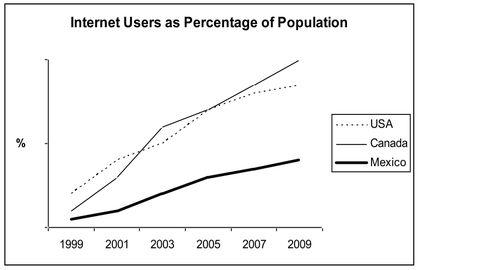
The line graph compares the percentage of people in three countries who used the Internet between 1999 and 2009.
It is clear that the proportion of the population who used the Internet increased in each country over the period shown. Overall, a much larger percentage of Canadians and Americans had access to the Internet in comparison with Mexicans, and Canada experienced the fastest growth in Internet usage.
In 1999, the proportion of people using the Internet in the USA was about 20%. The figures for Canada and Mexico were lower, at about 10% and 5% respectively. In 2005, Internet usage in both the USA and Canada rose to around 70% of the population, while the figure for Mexico reached just over 25%.
By 2009, the percentage of Internet users was highest in Canada. Almost 100% of Canadians used the Internet, compared to about 80% of Americans and only 40% of Mexicans.
1.3 International migration in UK

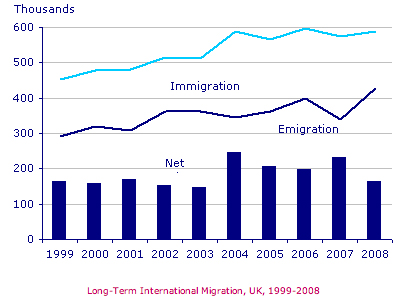
The chart gives information about UK immigration, emigration and net migration between 1999 and 2008.
Both immigration and emigration rates rose over the period shown, but the figures for immigration were significantly higher. Net migration peaked in 2004 and 2007.
In 1999, over 450,000 people came to live in the UK, while the number of people who emigrated stood at just under 300,000. The figure for net migration was around 160,000, and it remained at a similar level until 2003. From 1999 to 2004, the immigration rate rose by nearly 150,000 people, but there was a much smaller rise in emigration. Net migration peaked at almost 250,000 people in 2004.
After 2004, the rate of immigration remained high, but the number of people emigrating fluctuated. Emigration fell suddenly in 2007, before peaking at about 420,000 people in 2008. As a result, the net migration figure rose to around 240,000 in 2007, but fell back to around 160,000 in 2008.
(159)


